Category Archives: Uncategorized

“Britain’s genes”

Today’s issue of Nature features a study of the fine-scale genetic structure of the British population. My current supervisor, Stephen Leslie, was the primary analyst and lead author, and my DPhil (ex-)supervisor, Peter Donnelly, was a senior author. Congratulations guys!

They even made the front cover, check it out.

This is the first study to analyse the genetic makeup of a single country to such a level of detail that they can detect county boundaries, from the genetic data alone! Amazing stuff. They were even able to use genetics to answer long-standing questions in archaeology, such as whether the Anglo-Saxons intermarried or wiped out the existing population when they invaded (answer: intermarried).

They have attracted widespread international news coverage, including in The New York Times, The Guardian, BBC News, The Economist, ABC Science, New Scientist, and many more places.

Some news coverage that is ‘closer to the source’ is available from MCRI, the WTCHG and Nature.

If you like to listen rather than read, check out Peter Donnelly on this week’s Nature Podcast and Stephen Leslie on today’s episode of RN Afternoons on ABC Radio National.

Mod 13

When I was younger, I was a student at the National Mathematics Summer School (NMSS). We spent most of our time doing two things: mathematics and games. Sometimes it was hard to tell the difference. Certainly, there was one game we played, called Mod 13, where the two mixed in energetic bursts of mental arithmetic and chaotic shouting.

The game is a fun way to learn modular arithmetic, one of the core topics taught at the school. In fact, I believe the game was invented at the school, inspired by the lectures. Here is how to play it.

The rules

The game uses a standard 52-card deck. Start by dealing 7 cards to each player. Place the remaining cards face down to form the draw pile.

Flip over the top 2 cards from the draw pile to start the discard pile. From here on, any player with a legal card can discard it from their hand onto the discard pile. Players can play at any time in any order.

A legal card is one for which the number of the card is congruent modulo 13 to the result of one of the allowed arithmetical operations. For this purpose, aces are treated as 1, Jacks as 11, Queens as 12 and Kings as 13 (which, of course, is congurent to 0).

The allowed mathematical operations all operate on the previous 1, 2, or 3 cards in the discard pile. They are as follows:

When you play a card, you must shout out the name of the operation you are using. The standard phrases are shown in the brackets above. For example, if the top two cards are 3 and 7, a possible legal set of moves is as follows (starting with the first two cards):

 3
 7
10 (sum)
 4 (sum)
 1 (product)
 2 (sum of last 3)
 7 (inverse)
 2 (inverse)
 2 (product of last 3)
 4 (product)
 6 (AP)
 8 (AP)
 1 (sum)
 5 (GP)
12 (GP)
 4 (sum)
 7 (QP)
10 (sum of last 3)

*For AP, there’s a limit on how many times it is allowed to be used consecutively. It is as many times as the absolute value of the common difference in the AP. For example, if the top card is 6 and the one below it is 5, then you can place a 7 and shout ‘AP’, but no one can then continue it (because the common difference is 1). Another example is if the top card is 5 and the card below it is 2, then you can place an 8 as an ‘AP’, and it can be continued twice more (the next one is 11 and then 1), but then no more. If the common difference is -1, then you can still only continue the sequence by one card because the absolute value of the common difference is 1.

**A QP can only be played if the sequence being generated is a quadratic progression but not an arithmetic progression (it needs to be a ‘proper’ QP). This is to prevent players from circumventing the AP restriction described above.

If a player makes an error, and someone points it out, then the player must take their card back and also draw an extra card from the draw pile as a penalty.

If there is ever a long pause in the game (~10 sec for experienced players, longer for beginners), it is standard assume that no one has a legal card to play. At that point, everyone draws one penalty card, the current discard pile is set aside, and a new discard pile is started by flipping over the next 2 cards from the draw pile.

The first player to discard all of their cards wins the current round.

A single round of Mod 13 is usually quite short. A full game consists of multiple rounds. The winner of each round starts with one extra card in subsequent rounds, which accumulates with each win. The first player to win a round after starting with 13 cards wins the game.

Tips and variations

  • If you run out of cards in the draw pile, pause the game to replenish it from the discard pile. Resume the game by drawing the top 2 cards, like at the start of a new round.

  • You can play this game with any number of players. Simply add more decks of cards until you have enough. You can also have any number of draw piles, simply divide and spread them around so everyone has one within easy reach.

  • You can vary the length of the game by changing the starting number of cards. For example, starting with 5 cards rather than 7 makes the game longer, since more rounds are required for someone to get to 13 cards. You can also change the target number to be smaller or greater than 13 cards.

  • You’ll find that it’s easier to do the mental arithmetic if you think of a Queen as -1, a Jack as -2, a 10 as -3, etc.

  • The game becomes quite chaotic as you increase the number of players and as the players increase in skill. This happened without fail at NMSS. Each round became more and more rapid, making the shuffling and dealing between rounds quite tedious in comparison. To maximise gameplay, we got lazy and invented the NMSS shuffle. This involves flipping all the cards face down and everyone helping to spread them around vigourously. Then everyone simultaenously picks up cards at random to form their hands, and helps to gather the remaining cards to form one or more draw piles.

Not even a pie chart

My mailbox has recently been deluged with pamphlets making all manner of outlandish claims and promises. There must be an election coming up.

A graphic on one of the pamphlets caught my eye:

Not a pie chart

Now, we all know that pie charts are evil and should be banished. However, on closer inspection I realised this is not a pie chart. In fact, I’m not even sure if it is trying to pretend to be one? It certainly doesn’t make the information easier to read or add any credibility to the message. Not that the particular political party who sent it has much credibility left to lose…

Statistics capstone

On Tuesday, SSA Vic hosted a panel discussion on Statistics education in the age of Big Data. One of the panellists was Julie Simpson, who I work with at ViCBiostat. She decided to poll the ViCBiostat postdocs beforehand to get our thoughts and channel them into the discussion.

I thought back to how I would change my undergraduate learning and came up with two suggestions:

  1. End-to-end exposure on working with real problems. That means everything from planning an experiment or study, dealing with the acquisition and cleaning of the data, through to delivering a final report or presentation (or interactive web app…).

  2. A mental map of statistical methods. That is, a broad understanding of all of the different areas of statistics (and machine learning, data mining, etc.), how they relate to each other, and what types of problems each of them are useful for. I think is more useful than learning to be highly proficient in a few methods and being ignorant of what else is out there (which accurately describes my state after undergrad, although it was even worse because I was too ignorant to appreciate how ignorant I was!).

Ideally, both of these would be slowly developed over the whole degree, but they can also be explicitly taught as part of a ‘capstone’ subject in the final year. A quick web search for ‘statistics capstone’ reveals that some universities (mostly in the USA) indeed seem to run subjects of this sort, especially focusing on the ‘end-to-end’ aspect. I don’t know if they also provide a mental map. If not, I think that would be a valuable addition.

Barriers to reforming statistics education

Last week I gave a talk, Factors for success in big data science, at the University of Melbourne. This was to the Big Data Reading Group, a recently formed informal group within the Department of Mathematics and Statistics.

I had three aims for my talk: to give a brief overview of some ‘big data’ projects I have been involved in; to describe what I think made them successful (especially factors that are transferable across projects); and finally to suggest ways we can reform statistics education at university to foster such success.

In a nutshell, I advocated for a more practical focus in our education, with explicit teaching of data management and programming skills, more emphasis on using real (and messy!) data, and more time spent doing projects, including as part of a group. See my slides for more details.

I’m certainly not the first to suggest such changes. In fact, this seems to be one of those perennial discussions that gets rehashed regularly, with university inertia preventing too much rocking of the boat. However, given the recent surge of interest in ‘big data’ and ‘data science’, and the call from our leaders to reform our profession (such as Terry Speed and Bin Yu), I thought this was a perfect opportunity to have this conversation.

The barriers

About a dozen people came to my talk, including four senior academic staff. We engaged in an extensive discussion which, judging by how far we went overtime, made it clear that we were all passionate about this topic. We agreed that reform would be an excellent idea. The hard part was how to do it. These were the main barriers put forward by members of the audience:

  • Lack of resources. This refers to funding cuts, lack of qualified teaching staff and university rules that prevent running subjects with too few students. Ultimately, it all boils down to a limited (and shrinking) pot of money.

  • Student resistance to change. Apparently, current students are more interested in the mathematical side of statistics and do not like open-ended assignments. As Rafael Irizarry reports, teaching the messy parts of applied statistics ‘requires exploration and failure which can be frustrating for new students.’ Many students also dislike group work, partly because additional effort of working with others and partly because they believe the assessment allows some students to free-ride off the efforts of more diligent ones.

  • Students are ill-prepared by high school. Much of the early undergraduate teaching is spent on getting students ‘up to speed’ due to weak teaching at high school, leaving less time to learn new things.

  • Not enough time for the ‘basics’. There was a view that the current syllabus does not even cover the basic material properly, let alone have any room to add new things.

Overcoming the barriers?

These are real concerns and it is clear they have occupied many people’s minds.

Lack of resources is a fundamental challenge. I do not doubt that our mathematics and statistics departments are under-funded and that more money would make a measurable difference. Nevertheless, there is still a question about how best to spend the existing money.

I believe we don’t yet have the balance right. If learning to manipulate real data is not a ‘basic’ statistical skill, then what is?

We can try looking across campus for help to adapt our teaching methods to more closely reflect real world scenarios. Engineering departments have students regularly work in groups and engage in realistic projects. What can we learn from them? Perhaps we need to look at some good practices for assessing and communicating group work?

We can also look for ways of getting more money. Since income depends strongly on student numbers, can we attract more students? With the surge of interest in big data and data science, surely there is now a strong market for a practically focused statistics course?

Other universities are responding to this demand by innovating and developing new courses. Some courses are even available online, such as the Data Science Specialisation on Coursera, run by three prominent biostatisticians at Johns Hopkins University.

I see this as a challenge for the future of the statistics profession. By no means do I think any of this is easy to implement, nor do I claim any personal expertise in tertiary education. I look to leadership from statistics departments because I worry that students interested in data analysis will look elsewhere and will miss out on learning key statistical principles.

The academic staff from the department said that three new statistics subjects are planned for next year. I hope they feature a decent dose of data analysis.

Data science is inclusive

I’ve often heard data science described as a combination of three things: mathematics & statistics, computer science (sometimes simply called ‘hacking skills’) and domain knowledge. Drew Conway showed this using a, now ubiquitous, Venn diagram:

Drew Conway's data science Venn diagram

This accurately describes the set of skills that an employer is after when they seek to hire a single data scientist.

However, such people are rare. They have been compared to unicorns. To depict data science as an intersection of these skills presents a misleading picture of our ‘profession’. In reality, the term ‘data science’ covers work that is done by many existing professions.

To do data science on a decent scale, we need to engage a multidisciplinary team of data scientists who collectively have the required expertise. None of them will be unicorns, but together they can fill out the Venn diagram. That means data science is more accurately viewed as the union of these skills:

Data Science Venn Diagram v2.0

Evan Stubbs emphasised these points last week in his talk, Big Data, Big Mistake. According to him, the relentless search by employers for ‘unicorn’ data scientists has led to disappointment and disillusionment, and we need to communicate to them the idea that data science is groups of people.

With ‘data science’ now a mainstream term, we have a fantastic opportunity to unite our professions under a common banner and combine our skills together to solve problems we cannot do alone. This is not only good for all of us as practitioners. It is also what society seeks from us.

Let us embrace data science as an inclusive discipline.


Drew Conway’s Venn diagram is licensed under a Creative Commons Attribution-NonCommercial Licence and is reproduced here in its original form. The Data Science Venn Diagram v2.0 is an adaptation of Drew Conway’s diagram by Steven Geringer and is reproduced here by permission. The image of both diagrams link back to the original source.

Adam Bandt discusses evidence-based policy

Two weeks ago the Federal Member for Melbourne, Adam Bandt, gave a public lecture on the role of evidence in public policy in Australia. I helped to organise this talk as one of the monthly events for SSA Vic. Our goal was to hear how evidence is used (or not) by decision makers, in this case politicians.

Adam’s covered many topics and fielded a large number of questions from the audience. You can listen to the recording to hear it all (approx. 1 hour). Here, I summarise the points that stood out for me.

Lessons learnt from climate change policy

Climate change featured prominently in both Adam’s talk and the audience’s questions. As part of his role in the previous government, Adam was frank in describing both their successes and failures. Two of these stuck with me.

Early on, the government put together a committee to develop a set of policies to tackle climate change. It consisted of parliamentarians from multiple parties, and an equal number of experts from a variety of fields. Adam said the presence of the experts changed the dynamic of discussion considerably:

‘When you are sitting across the table from an expert…your ability to prosecute crap arguments diminishes drastically. You’ll be held to account very, very quickly by someone who’ll just tell you that’s simply not right.’

Seems like a great idea to me. Getting politicians and experts talking together, surely it’s a no brainer? Shouldn’t this happen more often?

On the other end, one of their major mistakes started once they had developed their policy and passed the legislation. They presumed there was no longer any need to talk about the problem. The public information campaign that followed concentrated on details of the carbon price and the compensation package, with little mention of global warming or the fact that this legislation is tackling a big social problem.

‘The failing to talk about the problem, and just presuming because you have a good technocratic fix to it then that’s enough, is part of the problem,’ according to Adam. This allowed the Opposition to shift the debate to be about something other than the underlying problem, to a debate about the Government’s credibility, without any reference to climate change.

Adam’s 3-step plan

Often it’s easy to point out problems but much harder to come up with solutions. Adam offered us three.

1. Entrench facts into government decision making, by law

Adam suggested two ways of doing this. Firstly, by setting up a sustainability commissioner in various government departments, whose role is to provide independent scientific advice (for example, about the impacts on biodiversity or energy use). The key point is that the relevant minister would be required, by law, to take that advice into account. Of course, they could chose to ‘ignore’ any advice but they would need to make a statement to this effect. Adam believes this would change the dynamic of many decisions and make evidence harder to ignore.

Secondly, an increased use of randomised controlled trials (RCTs) as part of policy development. However, Adam was a bit reserved on this point, wanting to see more evidence that these are indeed effective. He mentioned that a large review was underway in the UK to assess the ability of RCTs at measuring the effects of social policy.

2. Increase the scientific literacy of the population through public education

Those who wish to attack evidence-based positions can resort to variety of underhanded tactics. One is to manufacture doubt. Another is to falsely undermine the evidence by blurring the distinction between evidence and moral values.

Adam believes that increasing scientific literacy can help to blunt both of these attacks, and also lead to increased acceptance for a greater role for evidence in decisions. He would do this by investing more in science and mathematics education in primary and secondary schools.

A byproduct of such an education would be a greater ability by the public to distinguish between the use of evidence versus the use of values to guide decisions. Hopefully, this will lead us to a situation where politicians would be allowed (in fact, compelled) to change their policies in response to new evidence without being falsely accused of ‘flip-flopping’.

3. Get scientists & researchers to be more political

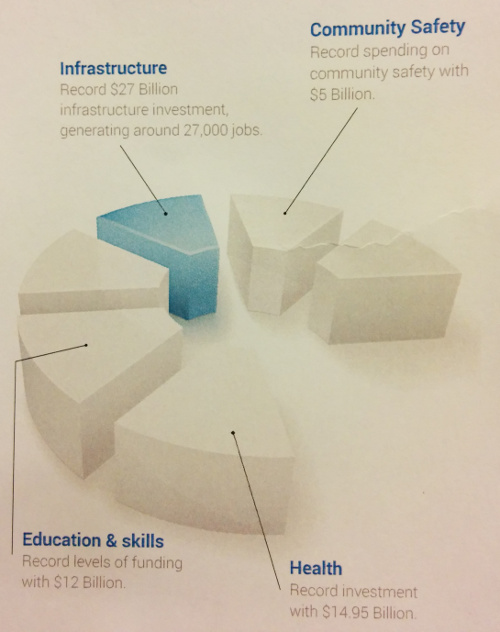
Adam’s final message was directed squarely at us, the scientists and researchers in the audience. Unless we fight for our slice of the political pie, according to Adam, it will be instead taken by those (of which there are many) who are motivated by self-interest and not necessarily the evidence.

One way to get political is to (like Adam) leave our jobs and stand for election. It would be great to have a few more scientists in Parliament, but that won’t be enough nor is it a realistic prospect for most of us.

Instead, Adam urged us to get organised and pool our efforts. Some of us will need to go out in public and advocate on behalf of scientists. We will also need an effective campaigning organisation. (Adam mentioned the Australian Academy of Science but noted that it acts more as an advisory body than as a campaigning organisation.) Comparing our plight with that of the mining industry, which collectively ran a multi-million dollar advertising campaign against the mining tax, Adam asked, ‘Where is the alternative, equivalent organisation…[who will] run a TV advertising campaign for science & research?’

The question of money arose. Adam admitted that this is indeed a challenge. However, a surmountable one. He said we need to find ‘allies’ out there who have an interest in Australia being a well-resourced, research & science community. There are many of them around and they are just waiting to be pulled together.

To explain or predict?

Inspired by a recent blog post from Rob Hyndman, last week I read Galit Shmueli’s paper, To explain or to pre­dict?.

I cannot recommend this paper enough. It should be essential reading for anyone involved in data analysis.

Shmueli distinguishes two different aims when analysing data: prediction and explanation. She describes in detail how the modelling and analysis process should differ whether you are doing one or the other. She even shows a concrete example where the model that works best for prediction is different to the model that works best for explanation. This was a key insight for me. Previously I had assumed the intuitively appealing idea that the best model for one will also be the best for the other. I’m glad to have this corrected. I see this idea advanced all the time, and now I know for sure that it’s false.

Another key message from Shmueli is that even though our primary aim will be either prediction or explanation, we should, if possible, assess our models on both criteria. We would expect good models to perform reasonably well in either setting, and it will usually be insightful to assess both.

Bin Yu gave a talk earlier this week on ‘mind-reading’, showcasing her group’s work on reconstructing movies from brain signal measurements. In one step of their modelling process, they do a trade-off between ‘explainability’ and ‘predictability’. Specifically, they chose a model that was easier to interpret at the expense of a bit of predictive performance. This is the first time I’ve seen anyone do this explicitly. It reminds me of the bias-variance trade-off and talks directly to the ideas in Shmueli’s paper.

Car share cost comparison

When I moved to the UK to study many years ago, one of the big changes for me was living much closer to my workplace. Having grown up in the Melbourne suburbs, this was a revelation. Suddenly, I didn’t need to spend hours every day commuting. I was an instant convert. It also allowed me to avoid buying a car, very handy on a student budget.

Upon returning to Melbourne, I was keen to continue a minimal-commute, car-free existence. I now live and work close to the CBD. Public transport is very easy when you are so central, there is plenty of choice and frequent service. I’m pleasantly surprised how little I actually need a car.

Nonetheless, sometimes only a car will do the job. What are the best options out there? The familiar ones are to take a taxi or rent a car. Over the last few years, a new option has entered the mix: car sharing. This is similar to renting, but you can book a car for shorter periods of time (for example, 2 hours for a big shopping trip) and with less hassle (simply reserve a car online, and then pick it up and drop it off without signing any forms).

Three car share businesses have established a presence in Melbourne: GoGet, Flexicar and GreenShareCar. I wanted to join one but it wasn’t clear which one was the best deal for me. Frustratingly, they each had a different pricing structure. So I whipped out the trusty spreadsheet and did some calculations, which made the choice much clearer.

Some people have asked me if I could share this around, so I’ve polished it up a bit and hopefully made it easy to use. You can grab a copy from here:

Australian car share comparison (Google Docs spreadsheet)

The instructions are on the first sheet. The easiest way to use it is to make a copy of it within Google Drive (File > Make a copy...).

The spreadsheet makes a number assumptions, such as averaging out your trips equally across all months, and not accounting for any uncertainty in the number of trips, but that’s probably fine for a rough estimate. Use it as a guide only, and trying different scenarios to see how much difference it makes.

Terry Speed sounds the alarm

Two weeks ago, the Victorian Branch of the Statistical Society of Australia celebrated its 50th anniversary. Many people turned out for the event, including a few members who were there right from the beginning. You can read a short historical account of the Branch in this short review from Ian Gordon and myself.

The clear highlight of the day was a lecture from Terry Speed, warning us that statisticians are at risk of being left out of the Big Data revolution. He certainly raised many eyebrows! Find out more in my review of his lecture.